Robotic Inference Project Writeup

Abstract

The first project in term 2 of the Udacity Robotics Nano Degree program requires students to initiate their own inference project inclusive of data acquisition. The project builds on the initial reference project for digit image recognition inside the supplied Nvidia Digits environment.

The project ideas are the student’s own and must have at least 3 classification categories eg defective item vs normal item with classes (no item, defective item, normal item).

Introduction

Pedestrian and bicycle lanes are often crowded with many people not aware of or selectively ignoring the signage. It can lead, to an unsafe or hazardous environment, for all that use it with police officers reluctant to enforce the rules via fines.

The concept selected, in this project, was to classify an image as either containing a pedestrian, not-pedestrian or background.

The goal being, that some sought of visual representation via a screen with a smile or a frown, could be given to act, as a robotic traffic controller. Other potential instantiation could include a torso using upper body movement to signal good or bad behaviour.

Background / Formulation

During the initial inference task, on supplied data, GoogLeNet was chosen as it had a good inference rate per image with reasonable accuracy. Using the Adam Optimiser with an initial learning rate of .001, it was able to meet the numerical requirements of inference time below 10 ms with accuracy > 75%. The input used for this reference model in Nvidia’s DIGITS was 256×256 3 channel colour images.

Similar requirements of accuracy would be required for this inference project. It was not necessary to be a 100% accurate as a smiling or frowning face at least makes people think about what they are presently doing. It was not going to be used to issue fines or other enforcement notices. Video cameras would stream image data between 24-30fps which means that an Inception, VGG model and some ResNet models may be too slow for inference in real time.

With the additional perception that colour could also be useful in detecting pedestrian vs not-pedestrian, GoogLeNet was again chosen for this project using the Adam Optimiser with an initial learning rate of .001.

Other experimentation with using a higher initial learning rate of 0.01 with the above configuration over 5 epochs did not improve validation accuracy which remained around 50%. Similarly AlexNet over 5 epochs with the same Adam optimiser and learning rate did not increase accuracy. One experiment was performed using GoogLeNet with RMSProp optimiser and an initial learning rate 0.001 which did not result in improvement of validation accuracy but did have significantly higher training loss so was also not progressed.

Data Acquisition

A GoPro mounted on a tripod was used. It was positioned on the side of a pedestrian esplanade at Surfers Paradise, Gold Coast, Australia. As it was summer holidays a reasonable amount of varying traffic was expected. The background looked over the ocean to have a consistent image where there was not going to be movement (besides cloud) other then what was on the esplanade.

GoPro Data Acquisition

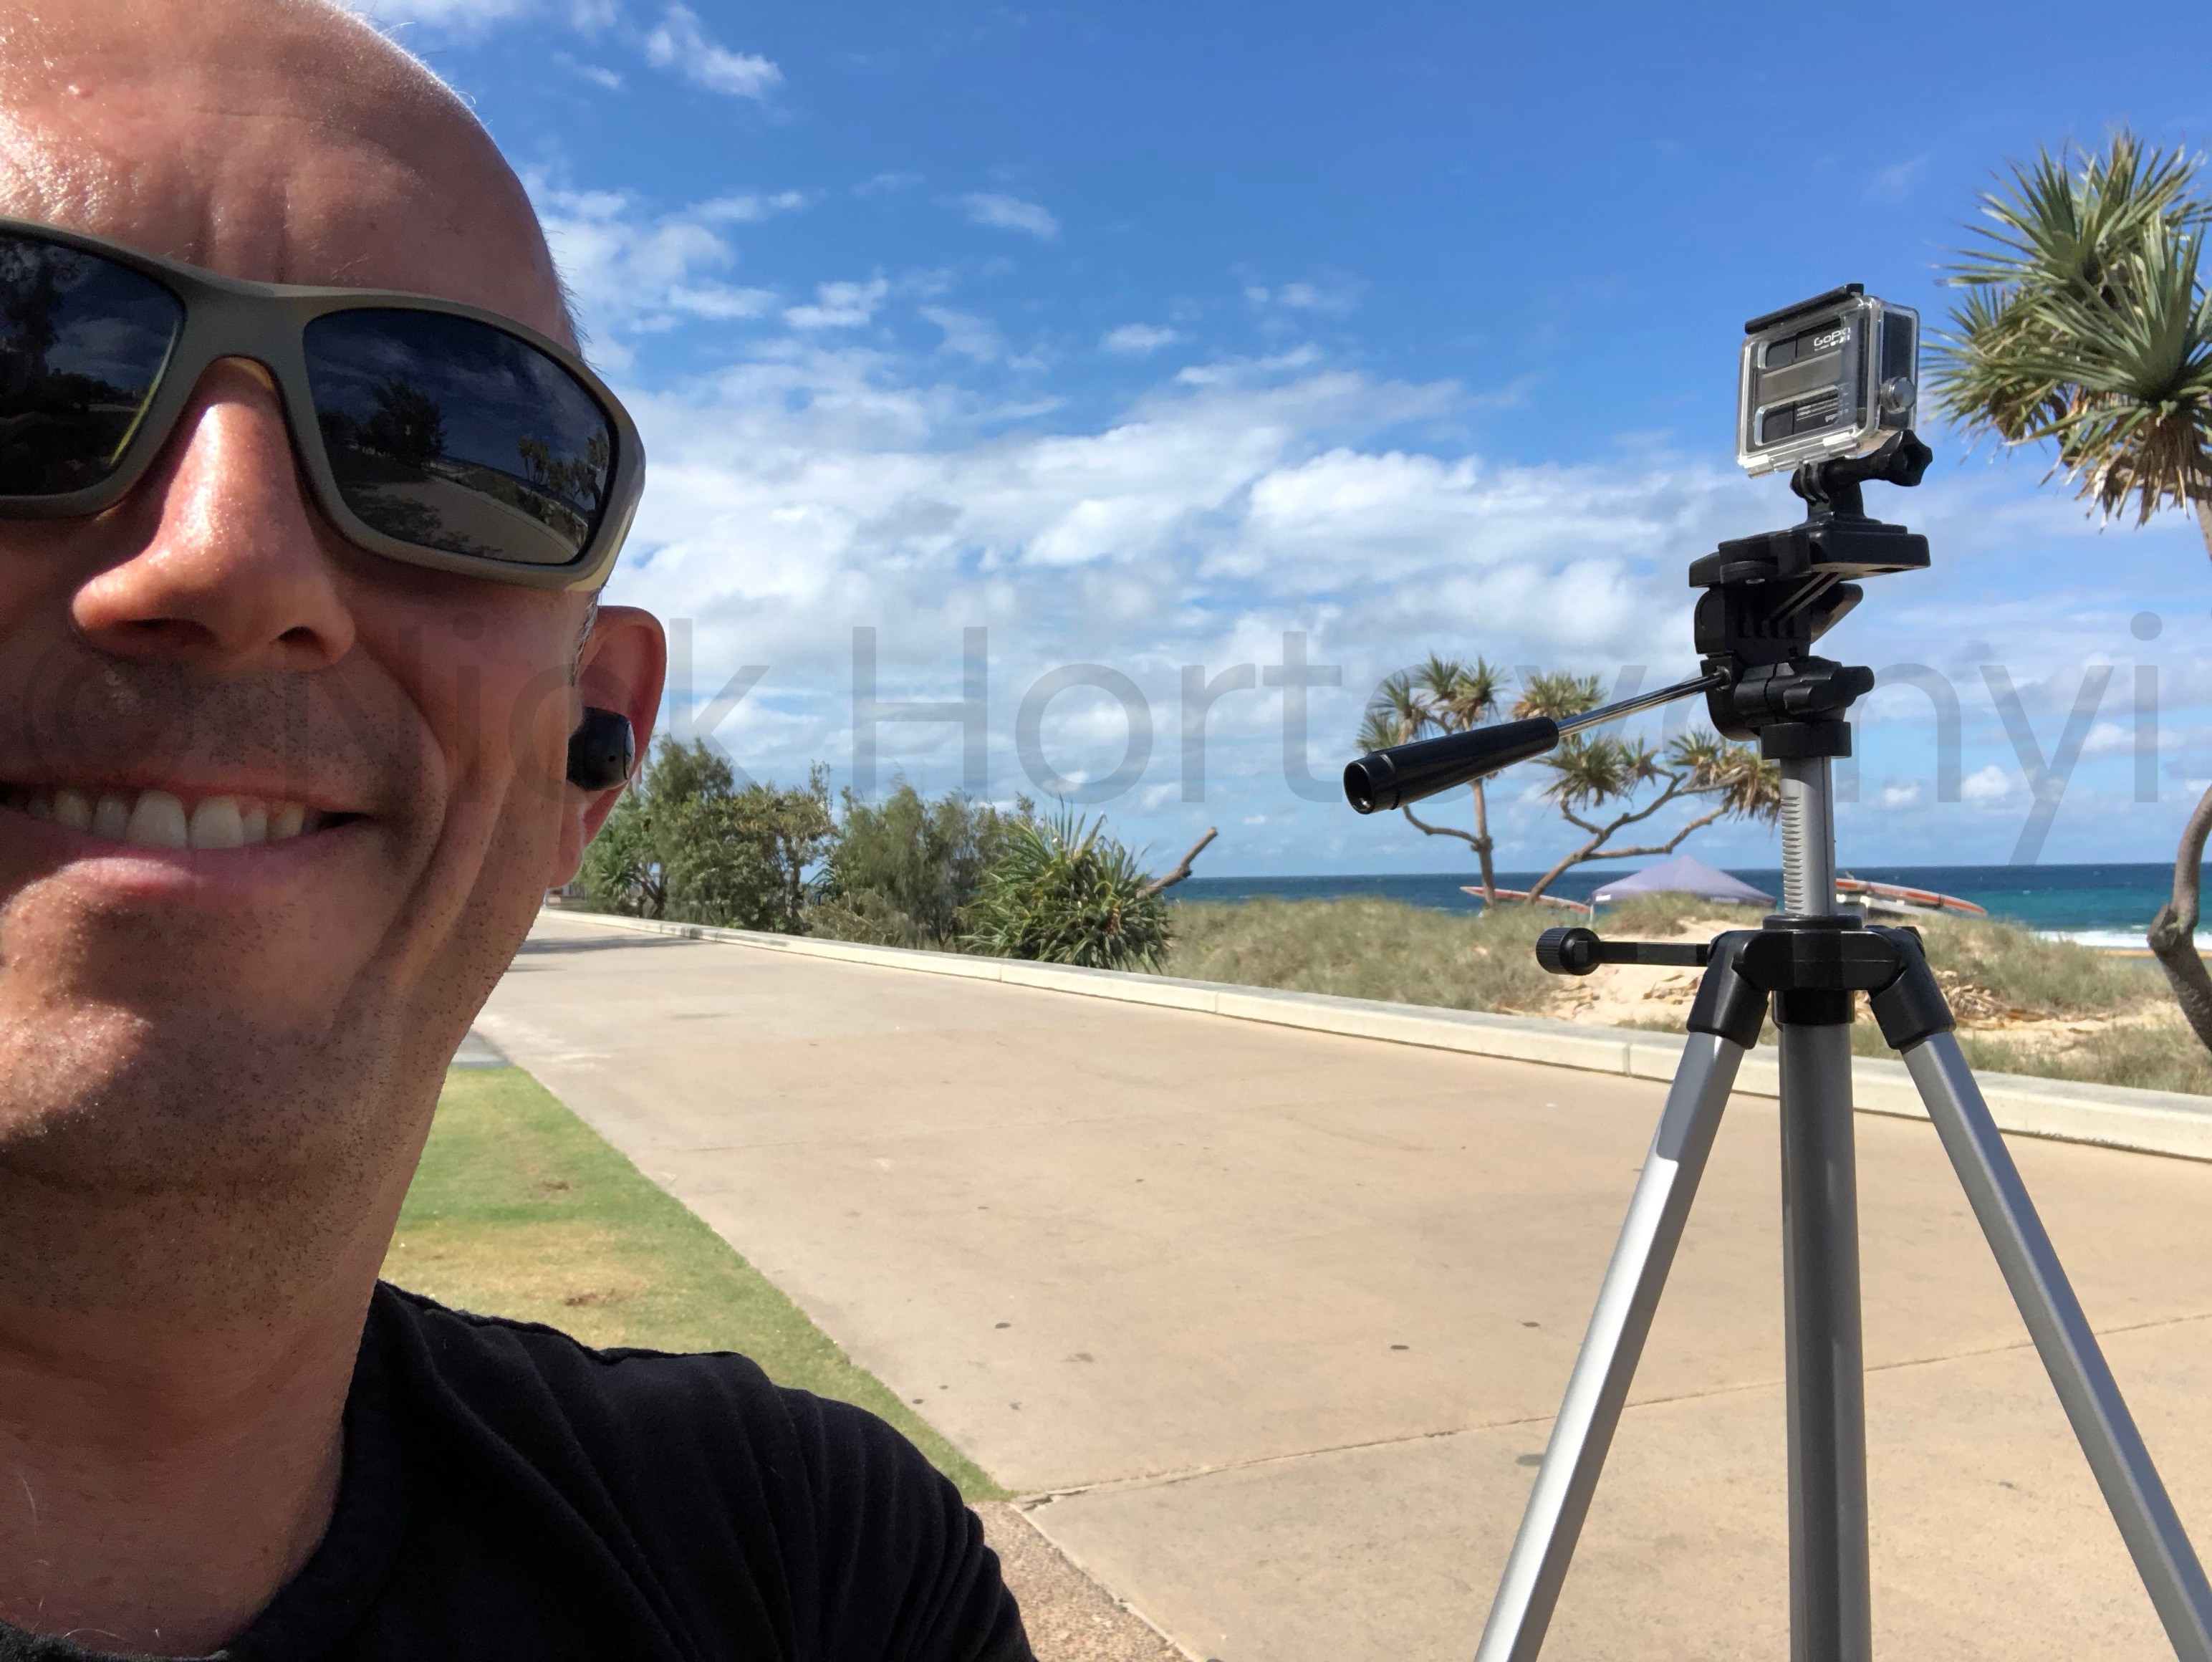
Three angles (facing left, centre and right) were used for capture per the following graphic:

Camera Background Angles

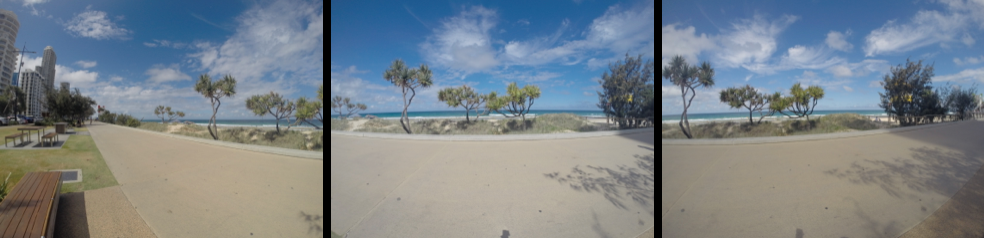
The GoPro was setup in wifi mode for time lapse capture, which was controlled via an iPhone. Initially 2 seconds elapsed was used, which eventually was dropped to 0.5. Using the GoPro time-lapse feature, meant that individual jpeg files were captured as opposed to a MP4 video.

Using the iPhone to control the control, meant that I could visualise what was coming before starting the next capture batch.

After the capture the images were manually placed into a directory for each category.

Image data was captured for the three categories background (322), pedestrian (349) and not-pedestrian (94). It became apparent at this time that not enough not-pedestrian image data had been captured. This was mainly due to the initial 2 seconds elapsed time used. Due to high heat and humidity of the Australian summer, in the following afternoons, it was not practical to capture more data from the same spot.

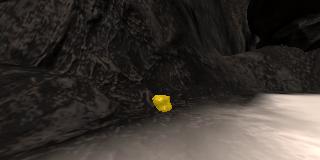
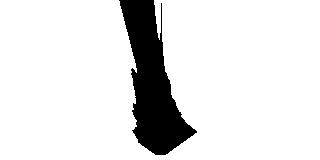
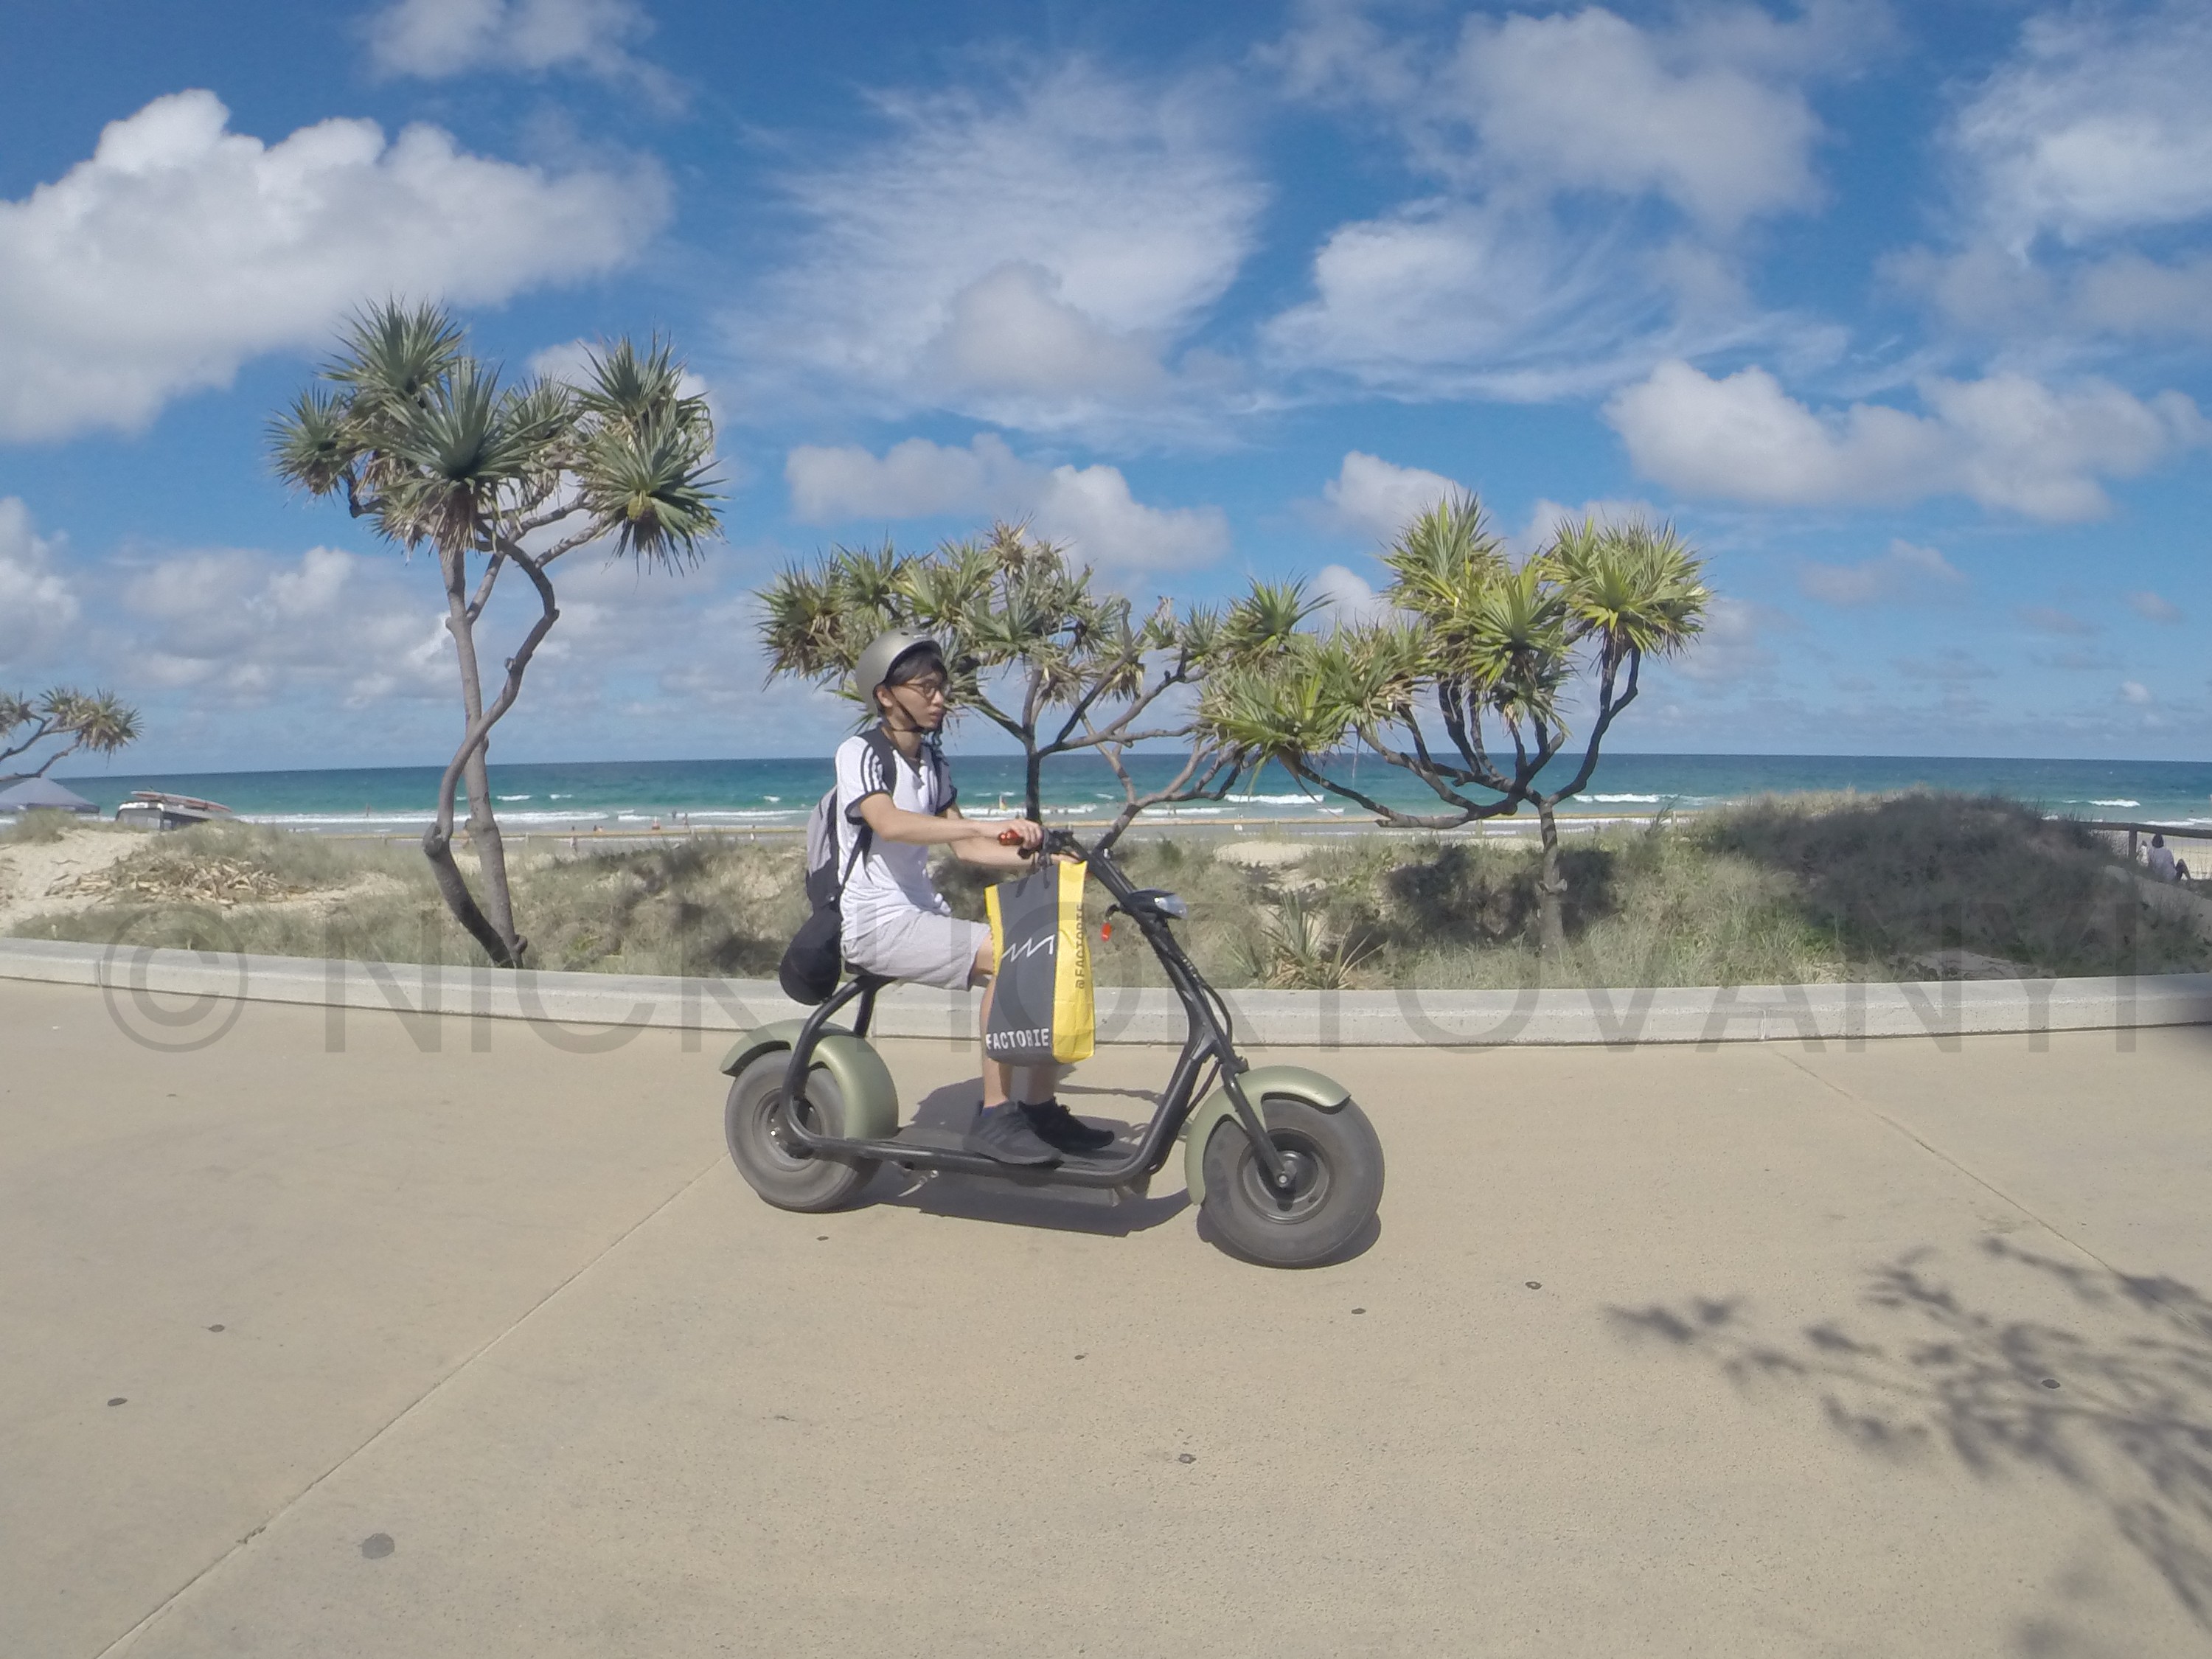
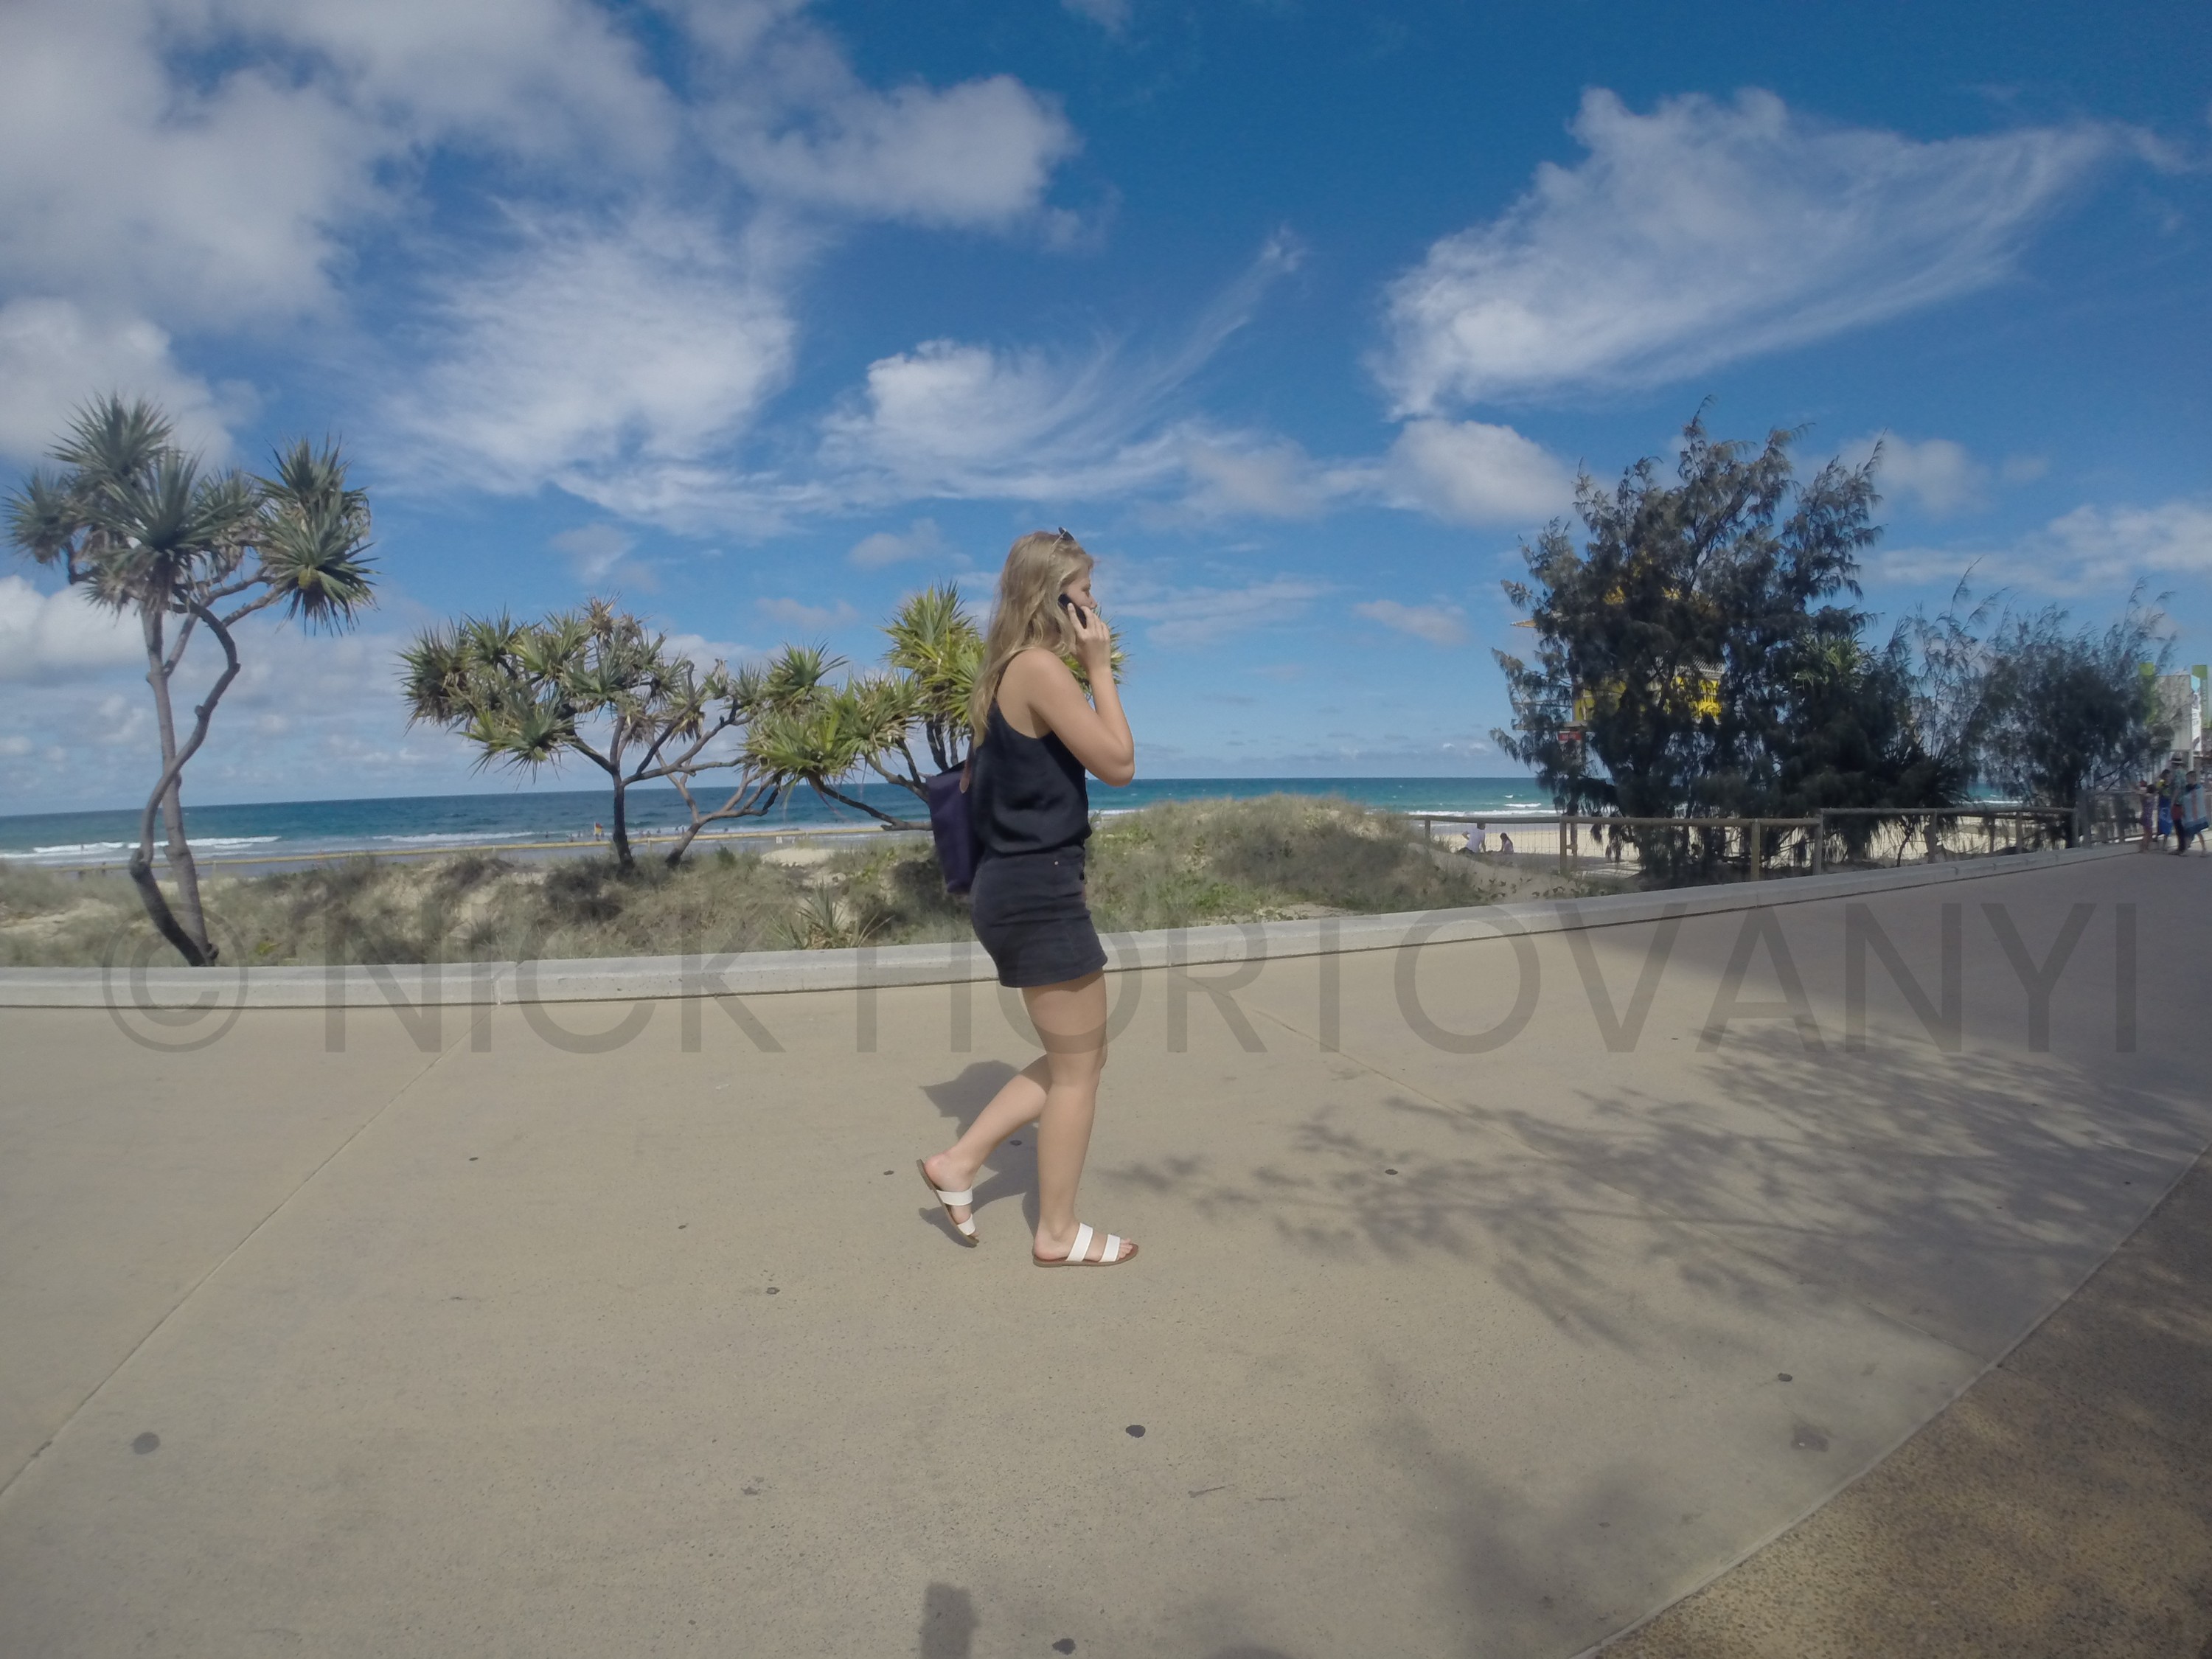
Skateboarders were placed in the pedestrian category.

An example of a pedestrian and not-pedestrian follows. Background examples are as above.

not-pedestrian example
pedestrian example
pedestrian example

A jupyter notebook was used to create a generator to supplement the data by randomising the image brightness, randomly flipping the images vertically and jittering the images randomly
in the x (by or – 25 pixels),y (by or – 50 pixels) planes to create supplemental image data.

The images were also resized to 256 x 256 and saved as PNGs.

The final generated supplemental data had 2000 not-pedestrian, 1000 pedestrian with 1000 background images.

Results

The initial inference task, on supplied data, GoogLeNet was chosen as it had a good inference rate per image with reasonable accuracy. Using the Adam Optimiser with an initial learning rate of .001, it was able to meet the numerical requirements of inference time below 10 ms (~5 ms actual) with accuracy > 75% (75.40984% actual).

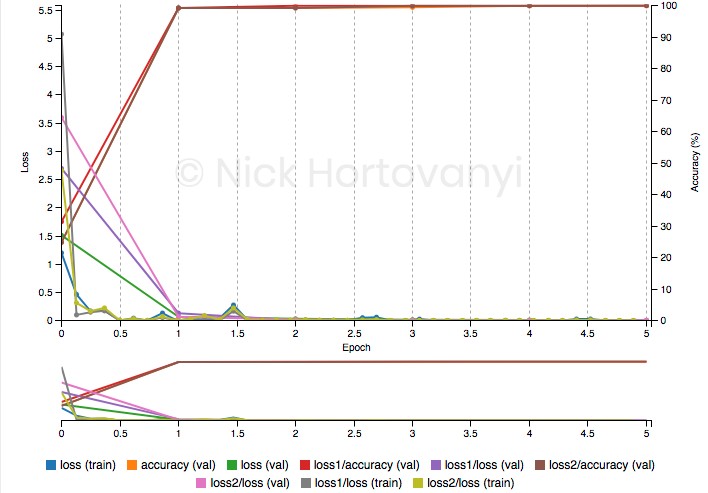
During training of the initial inference task 100% validation was achieved per the following training graph after 5 epochs.

Training Graph
Training Graph

However similar training results were not achieved for this inference project on captured data. The following training graph after 10 epochs follows

Project Training Graph

This had a validation accuracy of ~50%.

The following are the results of two randomly selected images per classification category uploaded as original high-res jpeg images from the GoPro.

Inference Background Sample
Inference Not-Pedestrian Sample
Inference Pedestrian Sample

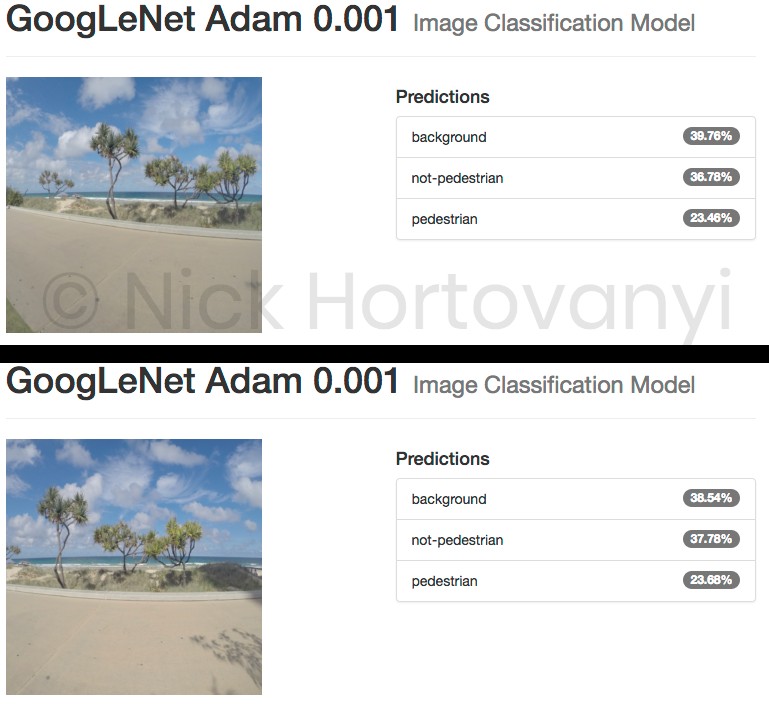
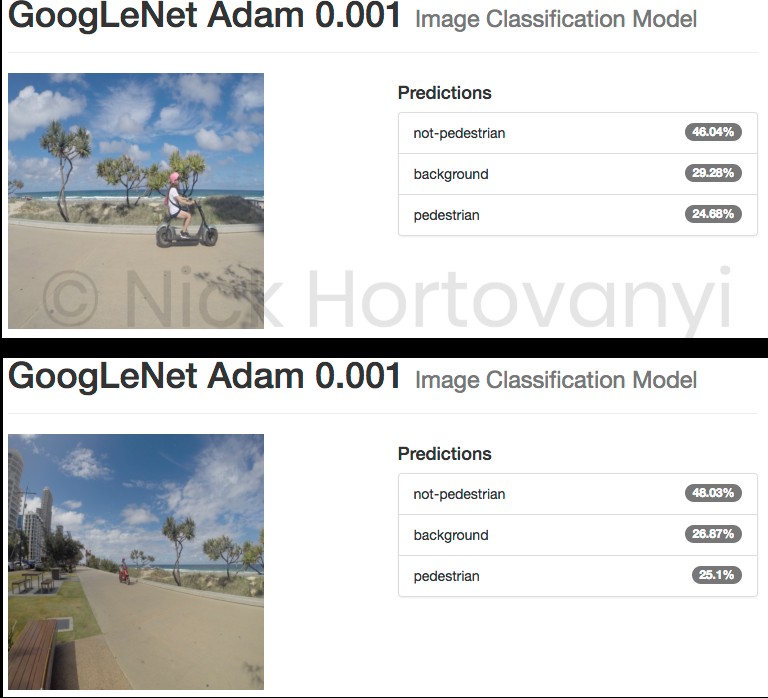
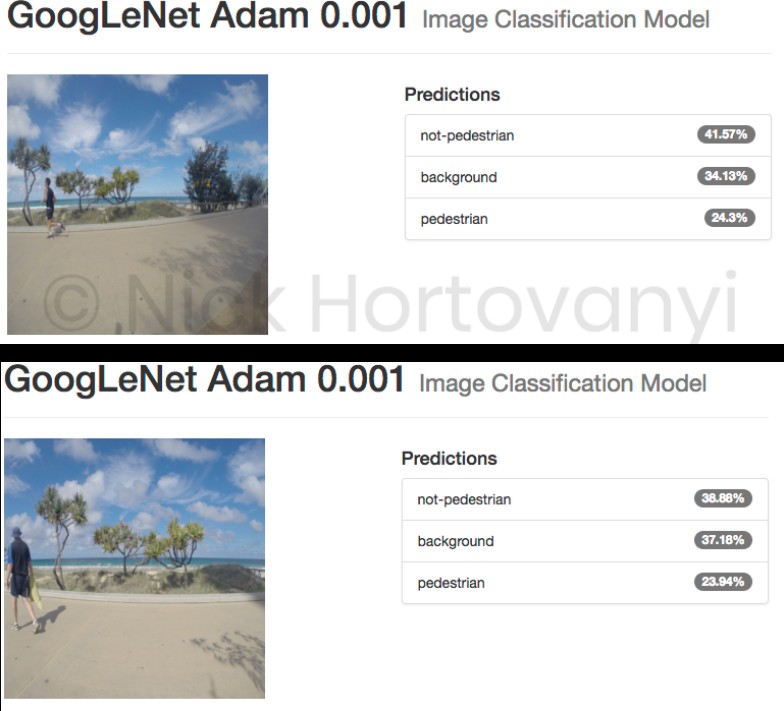
The indicative inspection suggests that there was insufficient data to get a result > 75% for this project at this time. It also appears that the model as trained can not distinguish between pedestrian and not-pedestrian but can distinguish a background image.

Inference times were not tested separately as GoogLeNet is known to have a fast inference time which would be sufficient for this project.

Discussion

The dataset collected did not have enough sample images. This was as a result of using time-lapse with too high a value. In hind site, a combination of 0.5-1 sec time-lapse for slow moving pedestrians with >30 FPS video for higher speed moving non-pedestrians would of allowed for more data.

Of note is when there is a combination of non-pedestrian and pedestrian in the same frame led to the though of potentially using object detection first to find a window to classify. This was not implemented in this version however it would have led to a more accurate ability to classify as the background would be eliminated ie if no objects detected it must be a back ground image.

For this project the duration of a consistent display of say 2 to 3 seconds to the passing pedestrian and non-pedestrian traffic would drive the ultimate inference time required. It would suggest that it needs to be an average classification of a 1 second or two when leading up to where the video is captured.

Of note were skateboarders. There is only the skateboard (which has a low profile in the image) that distinguishes it from a pedestrian as velocity is not taken account with single images.

In addition the depth (away from the camera) of the traffic passing by changes the size of the object that needs to be classified. Pre-filtering and zooming these to a consistent size may improve accuracy.

Future Work

Whilst the project did not achieve a good train validation result, it has laid the foundation for future iterations. There is potential to capture more data and use object detection to refine the training and inference steps of the project.

Providing soft means to monitor and influence peoples decisions regarding signage and the associated rules for safe usage of (non-vehicle) transit paths would potentially be received positively by the community. Police forces lack the budget or people to enforce these rules and they are reluctant to issue minor infringement notices (with potential to destroy good will in the community). Hence a more subtle robotic person could improve the situation in a cost effective means.

The size of this market is unknown. However speed cameras using smiley and sad faces are used around the local area where I live. They are having a positive impact on driver behaviour in the areas deployed. Thus there is a market for a more community friendly and automated means to impact on behaviour.

Not all software development is the same

Having completed, as one of the first, the Udacity Self Driving Car Nano Degree in October 2017, I thought I’d share some of the things I learnt along the way.

Rather than recap the projects, over the three terms, I’m going to focus in this post, on the philosophy and attitude I developed, to complete the nano degree program.

When I was first accepted, my initial reaction was geez have I bitten off more than I can chew. How am I going to cope with the mathematics and the theoretical side. It was a major concern.

Whilst at school I always had excelled at maths, and it was what led me initially into computing at a young age. I used to love writing graphics routines and optimising them. As my maths skills improved I learnt new ways of drawing circles and objects. I can’t remember if I got into Vectors. Yet past school, having started working in corporate IT, I had little use for maths skills besides that which was needed for Accounting. Yes for a number of years, IT dumbed down my maths skills.

IT was more focused on entering data, storing it and reporting on it at some monthly and yearly aggregate levels. Sure I worked on near realtime and mission critical systems but the need for very strong maths skills was limited. It was not a choice of my own, it was just that the technology that did leverage Maths, was perceived as scientific or too risky to adopt by business. It just didn’t have priority or urgency. Or if it was implemented it was a black box, that you supplied some input to, and you just consumed the output.

Getting back to the Self Driving Car Nano Degree, it was these black boxes that were our projects. In the project we needed to create the black boxes, to understand the theory and the mathematics.

Before starting the Nano Degree, I brushed up on matrices and vectors using the Kahn Academy.

Occasionally I got a little stuck on the mathematical proofs but once I understood the code for the maths, I normally was ok. Yes my brain now works off of code, not maths. We experienced some numerical instability, which was normally solved by interacting with others on the slack channels.

It was hard at times being the first going through the material. However with patience, with continuously reviewing the material, it reinforced what was being taught. You had to be methodical and test each assertion you were making about your code. Sometimes it required taking the algorithm and implementing in a repeatable test case inside a Jupyter Notebook. I found visualising the data improved understanding and helped to identify if anything was erroneous.

You could spend ages looking at the code and not see any obvious mistake. Without visualising the output, an easy mistake such as an incorrect sign in a rotation matrix, was not easy to observe.

The most valuable tool for when you got stuck was slack and your fellow students. These fellow students were online at all hours of the day, from across the globe.

After a few projects, I soon found an approach, that worked for me. It boiled down to learning, writing some code, seeing what happened, fixing what was broken, validating my learning and repeating until I had a project that met requirements.

Getting stuck, sometimes meant having a break, or having a late night. If I was really into tuning, it often meant the late night. Tweaking and trying different settings to get the Neural Network or Algorithm to achieve what you needed, was addictive. It was so much better, then reading or watching a video. The impact of changing your code was visible, in most projects in the simulator.

Your code didn’t produce a report, it produced observable action! It was like when I was a kid programming graphics for the first time.

So if your the type that likes to write those black boxes that other programmers use, you’ll excel at this Nano Degree. If your the type that consumes black boxes, that others have written, you may need to change your outlook.

Search and Sample Return

Robotics Nano Degree

Udacity - Robotics NanoDegree Program


Rover simulator output

The goal of this project were to use perception and decision steps to control a rover in a simulator. Perception occurs via using computer vision techniques to determine navigable terrain and then make decisions to take Action on the rover.

Its the first project of the Robotics Nano Degree program. I ran my simulator in 1600×1200 resolution. Different resolution may impact on the performance of the model in this project.

Notebook Analysis

The first step was to perform some analysis in a jupyter notebook on sample/calibration data.

Run the functions provided in the notebook on test images (first with the test data provided, next on data you have recorded). Add/modify functions to allow for color selection of obstacles and rock samples.

This step involved loading the data

Calibration data with grid
Rock Sample

and then doing a perspective transform to get a birds eye view.

Warped Example
Warped Rock

A function color_thresh was provided to do color thresholding (defaulted to RGB channels > 160). It was used as the basis to create an obstacle_thresh method (which selected the inverse ie RGB color channels <= 160). A rock_thresh method was created that selected between min and max color channels. The image color channels are converted from RGB to YUV before being used via warped_rock_yuv=cv2.cvtColor(warped_rock, cv2.COLOR_RGB2YUV).

Warped Threshed (white shows what is navigatable)
Obstacle Threshed (white shows obstacle)
Rock Threshed (white shows rock)

Populate the process_image() function with the appropriate analysis steps to map pixels identifying navigable terrain, obstacles and rock samples into a worldmap. Run process_image() on your test data using the moviepy functions provided to create video output of your result.

1) Define source and destination points for perspective transform
dst_size = 5 
bottom_offset = 6
source = np.float32([[14, 140], [301 ,140],[200, 96], [118, 96]])
destination = np.float32([[img.shape[1]/2 - dst_size, img.shape[0] - bottom_offset],
              [img.shape[1]/2   dst_size, img.shape[0] - bottom_offset],
              [img.shape[1]/2   dst_size, img.shape[0] - 2*dst_size - bottom_offset], 
              [img.shape[1]/2 - dst_size, img.shape[0] - 2*dst_size - bottom_offset],
              ])
2) Apply perspective transform

a warped image is created using the source and destination points from above warped = perspect_transform(img, source, destination)

3) Apply color threshold to identify navigable terrain/obstacles/rock samples

The thresh_min and thresh_max values were determined via an interactive cell in the notebook.

threshed = color_thresh(warped)
obstacle_threshed = obstacle_thresh(warped)
warped_yuv=cv2.cvtColor(warped, cv2.COLOR_RGB2YUV)
thresh_min=(0, 38, 153)
thresh_max=(145, 148, 170)
rock_threshed = rock_thresh(warped_yuv, thresh_min, thresh_max)
4) Convert thresholded image pixel values to rover-centric coords
xpix, ypix = rover_coords(threshed)
xpix_obst, ypix_obst = rover_coords(obstacle_threshed)
xpix_rock, ypix_rock = rover_coords(rock_threshed)
5) Convert rover-centric pixel values to world coords
world_size = data.worldmap.shape[0]
scale = 12
xpos = data.xpos[data.count]
ypos = data.ypos[data.count]
yaw = data.yaw[data.count]

xpix_world, ypix_world = pix_to_world(xpix, ypix, xpos, ypos, yaw, world_size, scale)
xpix_world_obst, ypix_world_obst = pix_to_world(xpix_obst, ypix_obst, xpos, ypos, yaw, world_size, scale)
xpix_world_rock, ypix_world_rock = pix_to_world(xpix_rock, ypix_rock, xpos, ypos, yaw, world_size, scale)

note: data.count contains the current position in index for the video stream.

6) Update worldmap (to be displayed on right side of screen)
for obstacle_x_world, obstacle_y_world in zip (xpix_world_obst, ypix_world_obst):
    data.worldmap[obstacle_y_world, obstacle_x_world, 0]  = 1
for rock_x_world, rock_y_world in zip (xpix_world_rock, ypix_world_rock):
    data.worldmap[rock_y_world, rock_x_world, 1]  = 1
for navigable_x_world, navigable_y_world, in zip(xpix_world, ypix_world):
    data.worldmap[navigable_y_world, navigable_x_world, 2]  = 1
7) Make a mosaic image

A mosaic image was created showing the rover camera image, warped image, ground truth (with rover location and direction arrow) and another ground truth (showing the current obstacle and navigable mapping)

Test video follows

Test Mapping Video

Test Mapping Video MP4

Autonomous Navigation and Mapping

Fill in the perception_step() (at the bottom of the perception.py script) and decision_step() (in decision.py) functions in the autonomous mapping scripts and an explanation is provided in the writeup of how and why these functions were modified as they were.

perception_step()

This step utilised the efforts from the notebook analysis, described above. The Rover Worldmap was not updated if there was observable pitch or roll (eg > or – 1 degree).

In addition rover polar coordinates were derived and saved against the passed Rover object for both navigable areas and observed rocks (if no rocks observed set to None).

decision_step()

This is the challenging part of the project.

stop and forward were the two default rover modes supplied. For this project stuck, rock and reverse were added.

forward was modified to have a left hugging biases by adding 65% of the standard deviation of the navigable angles, as long as there had been some travel time either initially or after being stuck.

The rover enters stuck mode if the rover stays in the same position, whilst not picking up a rock, for 5 seconds. If still stuck after 10 seconds, then reverse mode is tried. After 15 seconds, stuck and reverse are reset before trying stop mode.

stuck mode tries rotating if there is an obstruction in front, moving forward if steering not locked full left or right whilst going slow, and breaking if steering is locked full left or right. It will reset to forward if movement is restored.

reverse mode rotates randomly between 30 and 180 degrees after setting the brakes and reducing velocity to zero. Once its within or – 15 degrees it sets mode to forward. If reverse mode is in-affective to sets it to stop mode.

If a rock is observed, some false positives are ignored, as well as distant rocks before being placed into rock mode. Whilst the rock is not close, it tries to navigate closer towards it before breaking or coasting closer. The algorithm still requires more refinement.

Note: All my testing and running in Autonomous mode was done at 1600×1200 resolution.

The rise of chat bots and the fall of apps

It once was cool to build a mobile app and many startups in the past had built successful businesses with them and a minimalist web site. Now the chances of a new mobile app, creating mindshare and enabling a spot on a person’s home screen is next to impossible. We’ve reached peak app and new style of apps called chat bots are taking mindshare.

App stores are flooded, the majority of apps are rarely downloaded or found for that matter, as they do not rank.

It’s now harder than ever for a developer to build an app, that will replace the staple set of apps, a user does have on their devices. The frontier has changed to chat apps that have a conversational style interface either using text or voice (think siri). If you are building a new mobile app, stop! and reconsider how you are going to reach your target audience.

These new chat apps are leveraging existing instant messaging apps and agents on websites. Increasingly also APIs are being created and exposed to allow developers to interact with well known personal assistants like Siri. Some may argue that the interaction between human and computer is frustrating. I’d agree, having occasional back and forth sessions with Siri, to dial on my iPhone, a person I call regularly. However the situation is slowing improving as machine learning/AI technology improves behind the scenes.

Many will argue that we are not seeing anything new, that it is just the same technology and approaches that have been around for ages. The quest, as such to pass the Turing test where a judge can not determine if he or she, is talking to a machine or a person.

I think we’ve reached an inflection point, where a new class of conversation chat bot is being enabled by the gradual and constant exponential evolution of computing technology, sharing of open source component technology (such as natural language processing) in conjunction with the ongoing to quest to provide individually tailored answers to people’s own question through understanding the explosion of data available online.

This is also backed up by a dramatic increase in tech news coverage regarding startups in the US and with training/conferences covering this area.

So forget building a mobile app and start building a chat bot!


Switching off from Aussie innovation for the time being …

The slow dawn of reality has crept into my thinking, that what I’m presently witnessing, is the rise of politically correct innovation within Australia. That is, that there is a rush on, to be positioned, to secure funding and “innovation wash” existing service offerings, ready for when government programs come into affect.

My high hopes for an ideas boom have been dashed somewhat of late. Not so much from the intent, but from the reality, that the intent does not match reality. There is significant education (dare I say re-education) required.

Let me show you what I mean.

If we look at the innovation website Business.gov.au. (their definition here ), it basically suggests, that innovation is about change. It follows:

What is innovation?

Innovation generally refers to changing or creating more effective processes, products and ideas, and can increase the likelihood of a business succeeding. Businesses that innovate create more efficient work processes and have better productivity and performance.

Now if we look at the wikipedia innovation article  it suggests, The term “innovation” can be defined as something original and more effective and, as a consequence, new, that “breaks into” the market or society.

Innovation is a new idea, or more-effective device or process.[1] Innovation can be viewed as the application of better solutions that meet new requirements, unarticulated needs, or existing market needs.[2] This is accomplished through more-effective products, processes, services, technologies, or business models that are readily available to markets, governments and society.

So from my perspective the first one, is inwards looking, about the term innovation (as in thats an innovative idea) to do business change or continuous improvement.

I’ve often argued that changing a business process to make it more effective is not innovation. However if that idea, is bought to market, as a new product or services offering, then it is innovation ie there has to be diffusion into a market or society.

Now if we look at the slick new marketing or education material (your viewpoints may differ on this) being produced by National Innovation & Science Agenda Australian Government it refers to how Australians have been good at Ideas, but now we need to get better at commercialising –  turning those ideas, into new products or services.

As you can see, there is a long road ahead, with a lot of jargon presently such as “Ideas Boom”. It will take some time for people, to agree on what things mean (even though they have great definitions available now) and to reach consensus. Then decisions will need to be made about how much capital is to be made available and under what investment thesis it will be allocated.

There are a lot of people shouting about a number of things surrounding these topics and if your not shouting the politically correct message too then no matter how novel and disruptive your idea or invention is, it may not benefit from the “Ideas Boom”. If this is effecting you, jump on a plane and go to Silicon Valley or elsewhere that may be appropriate.

I keep hearing about the lack of opportunity here in Australia, in many fields on podcasts I listen to occasionally. On those podcasts, when people ask eminent panel members about their thoughts on the subject, invariably, their answer will be that we do hope you stay and help drive the next generation. It always surprises me, assuming that these persons are in tenured positioned, how devoid their responses seem to be, from the reality of needing money (or some may say capital) and support to do so. Its this later bit, that’ll take so long to grow here in Australia. It may also require a generational change. The notion of not taking risks in some is the antithesis of what is required in an “ideas boom” era.

So I’m thinking of slowly fading away from observing and commenting on all of this, until I need something concrete from it. Presently it all seems to be a nice discussion, but discussion is after all discussion and not tangible outcomes.